VIPA Documentation
2018.01.10 by Ed Trager
Last updated: 2018.06.15 by Ed Trager
Introduction
The VIPA data are currently divided into three parts:
The CASES table provides data on individual pedestrian and bicyclist cases. The table contains data on the type of accident, the accident conditions, the pedestrian or bicyclist who was involved, the year, make and model of the involved vehicle, and so on.
The CASES table itself contains groups of columns within sets of sections. The sections are, reading the columns from left to right, as follows:
- ⓘ → Incident Section. Columns here such as v_time_of_day refer to characteristics of the overall incident.
- ⓟ → Pedestrian/Bicyclist Section. Columns here refer to characteristics of the individual who was struck in the incident. Note however that injuries are not shown here, but are in the separate INJURIES table.
- ⓥ → Vehicle Section. Columns here refer to the vehicle: year, make, model, etc..
- ⓓ → Driver Section. Columns here refer to characteristics of the driver, such as whether they were distracted or driving under the influence of alcohol or drugs.
- ⓜ → iMpact Section. Columns here refer to characteristics of the impact or collision event. Note however that more specific information on the specific sequence of impacts or contacts are not shown here, but are provided in the separate IMPACTS table.
Occasionally one person may have been struck by more than one vehicle. Also occasionally several people may be struck by a single vehicle. These cases are considered as single incidents in which there were multiple impacts or multiple people involved. Hence, you may see rows in the table where the same v_incident_id occurs several times.
The INJURIES table list the injuries sustained by injured individuals. There may be multiple injuries for each individual in this table. The v_person_id in this table refers back to the v_person_id in the CASES table (many-to-one relationship).
The IMPACTS data table lists x,y, and z contact locations and wrap distances. The v_iop_id —the impact on person (iop) identifier— in this table links back to the v_iop_id in the CASES table (many-to-one relationship). There are multiple contacts for each individual in this table.
To clarify the distinction made here between impact and contacts, consider the following example: Suppose that a person is struck first by one vehicle, and then by a second vehicle. In this case, the person would appear in two rows of the CASES table, but each row would contain a unique impact on person v_iop_id identifier. Then, for each of those v_iop_ids in the CASES table, you would find several corresponding rows in the IMPACTS table showing each of the various impact points on the vehicle, such as front bumper, hood, side mirror, windshield, etc.. These are what we call contacts, and for each contact you will find relevant data such as the type of impact (i.e., trace vs. deformation, etc.) and x ,y, and z coordinates, inter alia.
Data Views
The web application provides three (3) views onto the data.
The grid windows labeled CASES, INJURIES, and IMPACTS represent the three primary views of the data as described above. The title bars of these primary grid windows are shown in blue.
For more sophisticated views, download the data so that you can perform your own custom joins across the three tables that we have provided. The primary keys are as follows:
- v_incident_id identifies unique incidents in the CASES table.
- v_person_id links people in the CASES table to injuries in the INJURIES table.
- v_iop_id links the broad impact event(s) in the CASES table to the finer contacts in the IMPACTS table.
Retrieving PDF Documents for Specific Cases
In the CASES view, all cases which have accompanying PDF documents are marked with green check marks in the icam_sf_no column. Simply click anywhere within a checked row to open the associated PDF. PDFs will open in a separate browser window.
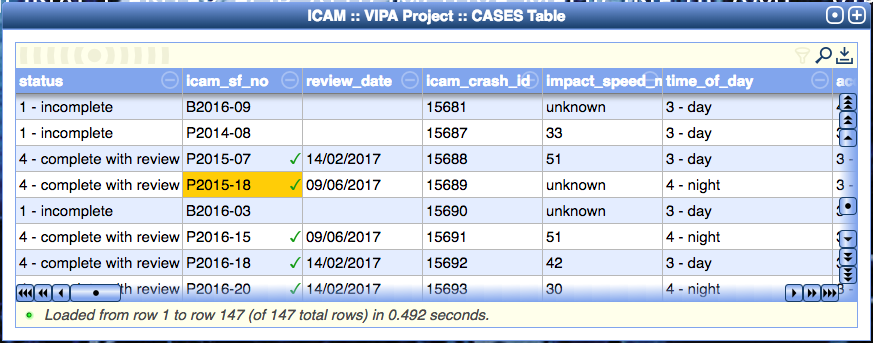
Cases with associated PDF documents are marked with green check marks.
Click anywhere within a checked row to open the PDF.
Using the Data Grid Windows
The data are conveniently displayed in flexible grid windows. This section describes how to use these grid windows effectively and efficiently.
The grid windows function more or less as window panes in operating systems such as Windows or MacOS operate. However these windows are part of the web application and do have some unique aspects. Basic usage is as follows:
- Click on the title bar or any other part of a window to bring it to the top of the window stack.
- Iconify a window by clicking on the [•]. Iconified windows will be displayed on a shelf at the bottom of the screen.

Iconified windows appear on a shelf at the bottom of the application window
- Maximize a window by clicking on the [+]
- In maximized form, the window's [+] icon is replaced with a [-] icon. Click on the [-] icon to restore the window to its original size.
- Double-click on a window's title bar to "roll up" the window as if it were a window shade.

A rolled up window
Scrolling across the Data Grids
The data grids provide many convenient features for viewing the data. Scrolling across the data is summarized below:
- Clicking on the [<<<] or [>>>] buttons allow you to quickly jump to the very beginning or very end of the data. Note that these buttons appear on both the horizontal and vertical scroll bar controls.
- Clicking on the [<<] or [>>] buttons allow you to rapidly scroll across the data. Note that these buttons appear on both the horizontal and vertical scroll bar controls.
- Clicking on the [<] or [>] buttons allow you to scroll across the data at a slower pace or one row at a time. Note that these buttons appear on both the horizontal and vertical scroll bar controls.
- You may also click and drag the scroll bar buttons marked with a central dot, [ • ], to move across the data grid.
Manipulating Data Columns in a Grid
The data grids also provide convenient ways to manipulate the columns. Usage is summarized below:
- You may freeze a column by clicking and dragging the column label onto the target at the top left, [(((•)))]. You can freeze multiple columns by clicking and dragging them one-by-one onto the target, [(((•)))]. Usually this feature is used to freeze key ID columns, or other columns that are of special interest so that these columns remain in constant view while you scroll through other columns.

Click and drag a column header onto the target to freeze a column

Frozen columns appear on the left and have a distinct background color
- You may unfreeze a column by simply clicking and dragging the frozen column label from the left and dropping it in the middle between any two columns in the unfrozen section on the right.
- You may also rearrange the order of columns by clicking and dragging one column label and dropping it in the middle between any two other columns in the same section. You can also rearrange the order of frozen columns in the same way.
- You may change column widths by dragging the vertical line on the right side of any column. Just drag the vertical line to the left or right. Note that columns do have a fixed maximum width which can not be overridden.
- You may also utilize the semi-transparent (-) and (+) buttons within the column header label to minimize or maximize column width.
- Right clicking on a column label brings up a context menu allowing you to choose the following options:
- Choose the [ ⋮ unique ] option to see a list of the distinct data values in a given column, along with their frequency and percentage of occurrence. The list is sorted with the most frequent data values at the top.
- Click on [ ↑ ascending ] to sort the entire grid based on the data values of this column in ascending order.
- Click on [ ↓ descending ] to sort the entire grid based on the data values of this column in descending order.

Right click on a column label to display the column context menu

Clicking on "unique" provides a listing of unique column
values with frequency and percentage of occurrence
Filtering Data
You may filter the data displayed in the grid by specifying search criteria. To begin, first click on the magnifying glass search icon.
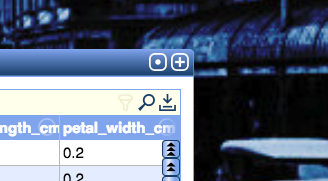
To filter data, first click on the magnifying glass search icon
This will bring up an advanced search window. Choose the columns and search criteria that you want to filter on. To filter on multiple columns, just press the (+) plus button and be sure to select a conjunction, either AND or OR. Note that you may need to wrap OR statements in opening and closing parentheses, ( and ), especially if you also include AND statements. To use parentheses, simply click on the ( or ) to toggle them as active. Be sure that you have matched pairs of opening and closing parentheses. Then just click on the Search button. To clear all filters, just press Clear Filters and the grid will return to displaying the complete data set.
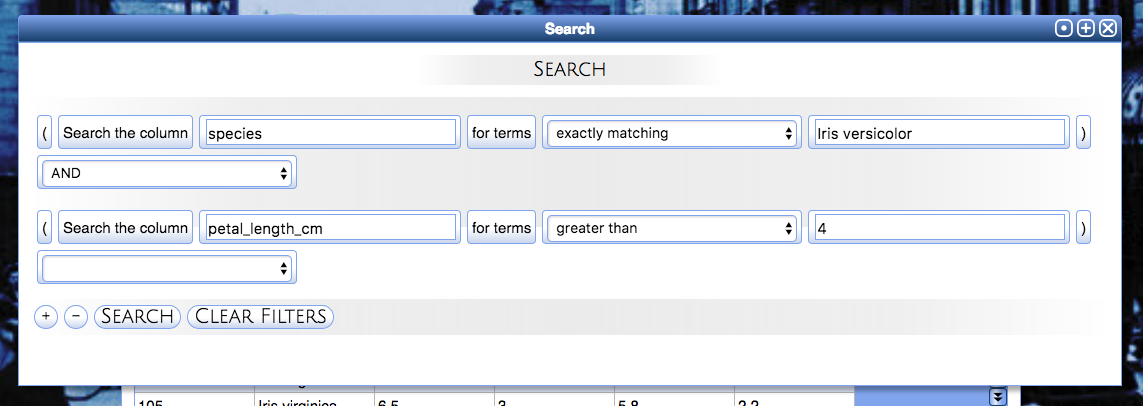
Choose terms and criteria to filter on in the Search dialog box, then click on the Search button.
The grid will now load the subset of data that match your search criteria. At the bottom of the grid, the status bar will indicate the total number of rows that match your search criteria. The grid will now display a green funnel in the upper right hand corner to indicate that an active filter is present on the view. To modify or eliminate the filter, simply click on the magnifying glass icon again.

A filtered data set. In this view, data have been restricted to observations of
Iris versicolor with petal lengths greater than 4.0 cm. The green funnel icon in the upper right
corner reminds us that this is a filtered view of the data.
Downloading Data
To download data, simply click on the download tray icon which appears just to the right of the magnifying glass search icon in the upper right corner of the grid.
To download data, click on the download tray icon
just to the right of the magnifying glass search icon
If any filters are active, then only the filtered subset of data will be present in the downloaded file.
The downloaded file can be easily opened in Microsoft Excel, LibreOffice, Pages, or a similar spreadsheet program.